产品属性/ Product Details
| 产品名称 | FS-Mouse MIγ/CXCL9(Monocyte Interferon Gamma Inducing Factor) ELISA Kit | 反应种属 | Mouse |
| Uniprot ID | P18340 | 别称 | Chemokine(C-X-C motif) ligand 9, CXCL9, Monokine induced by gamma interferon, MIG, CMK, Humig, SCYB9, crg-1 |
| 检测方法 | Sandwich | 灵敏度 | 1.42 pg/mL |
| 标准品 | 2000pg/mL | 检测范围 | 31.25-2000pg/mL |
| 样品类型 | Serum, Plasma, Tissue homogenate and Other biological samples;Sample Volume=50μL | ||
| 检测时间 | 1.5H | 研究领域 | Tumor immunity;Infection immunity;Cardiovascular biology;Rheumatology; |
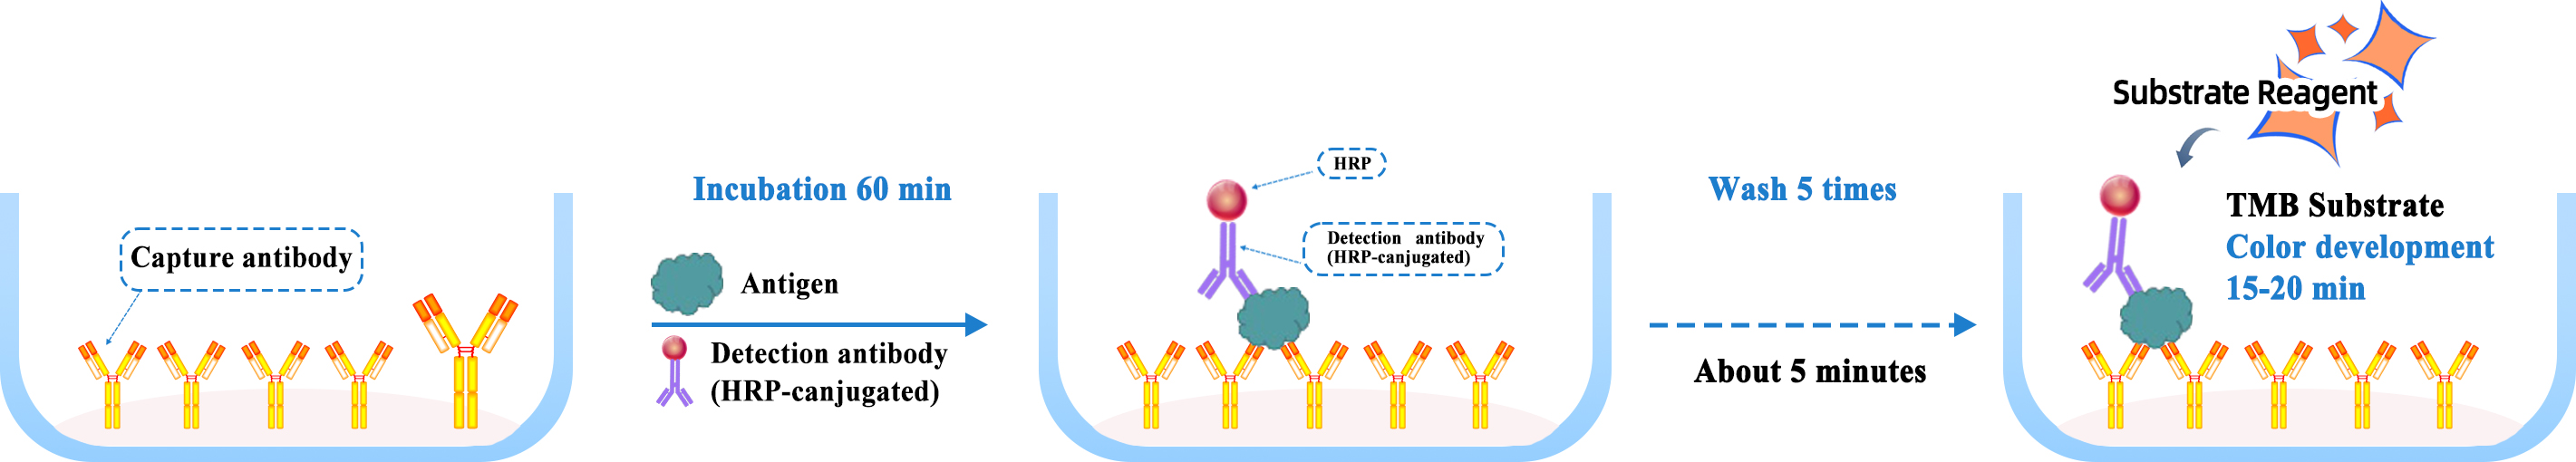
| 测试原理 | This ELISA kit uses the Sandwich-ELISA principle. The micro ELISA plate provided in this kit has been pre-coated with an antibody specific to Mouse MIγ/CXCL9. Samples (or Standards) and Horseradish Peroxidase (HRP) linked antibody specific for Mouse MIγ/CXCL9 are added to the micro ELISA plate wells. Mouse MIγ/CXCL9 in samples (or standards) combines with the coated antibody and HRP linked detection antibody special to Mouse MIγ/CXCL9. Excess conjugate and unbound sample or standard are washed from the plate. The substrate solution is added to each well. The enzyme-substrate reaction is terminated by the addition of stop solution and the color turns yellow. The optical density (OD) is measured spectrophotometrically at a wavelength of 450±2 nm. The OD value is proportional to the concentration of Mouse MIγ/CXCL9. The concentration of Mouse MIγ/CXCL9 in the samples is then determined by comparing the OD of the samples to the standard curve. | ||
技术数据/ Technical Data
由于实验操作条件的不同(如操作者、移液技术、洗板技术和稳定条件等),标准曲线的OD值会有所差异。以下数据和曲线仅供参考,实验者需根据自己的实验建立标准曲线。
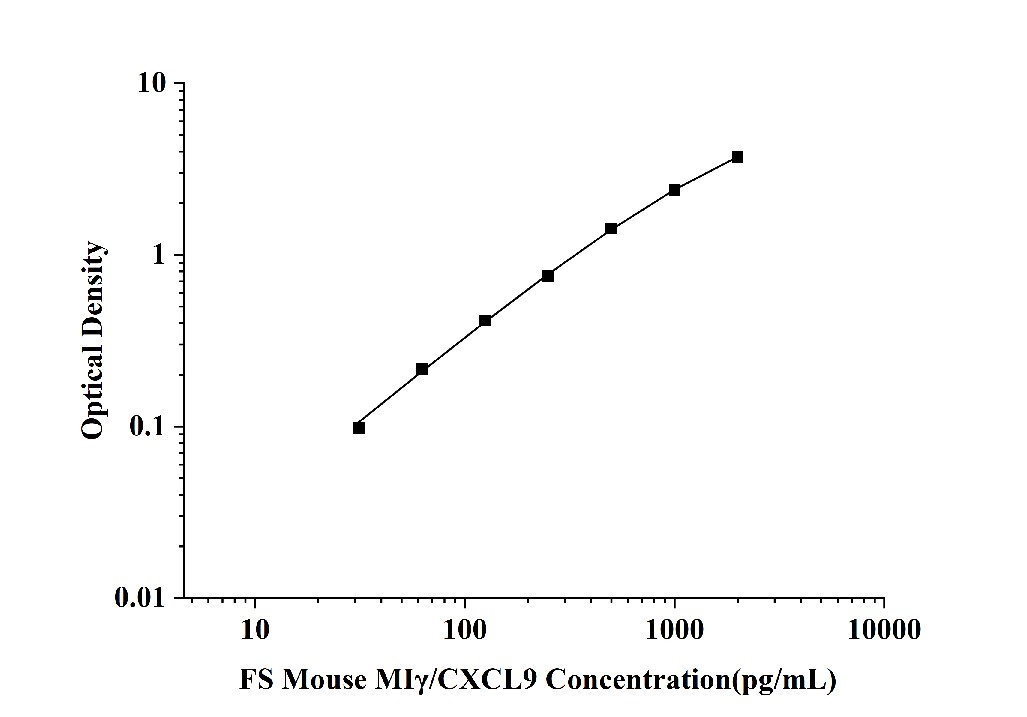
| (pg/mL) | OD | Corrected |
|---|---|---|
| 2000.00 | 3.738 | 3.728 |
| 1000.00 | 2.402 | 2.392 |
| 500.00 | 1.434 | 1.424 |
| 250.00 | 0.763 | 0.753 |
| 125.00 | 0.425 | 0.415 |
| 62.50 | 0.226 | 0.216 |
| 31.25 | 0.108 | 0.098 |
| 0.00 | 0.010 | 0.000 |
精密度
板内精密度:低浓度样本,中浓度样本和高浓度样本分别在1块板子上检测20次。
板间精密度:低浓度样本,中浓度样本和高浓度样本分别在3块板子上检测20次。
| Intra-assay Precision | Inter-assay Precision | |||||
|---|---|---|---|---|---|---|
| Sample | 1 | 2 | 3 | 1 | 2 | 3 |
| n | 20 | 20 | 20 | 20 | 20 | 20 |
| Mean(pg/mL) | 144.466 | 57.133 | 55.528 | 53.646 | 47.639 | 39.492 |
| Standard deviation | 39.011 | 37.754 | 36.107 | 10.526 | 8.455 | 11.591 |
| C V (%) | 5.975 | 7.398 | 8.921 | 8.844 | 11.945 | 7.451 |
回收率
分别往5个不同样本中添加已知浓度的目标蛋白,做回收实验,得出回收率范围和平均回收率。
| Sample Type | Range(%) | Average Recovery(%) |
|---|---|---|
| Serum (n=8) | 94-111 | 98 |
| EDTA plasma (n=8) | 91-110 | 103 |
| Cell culture media (n=8) | 89-109 | 108 |
线性
分别往5个样本中添加已知浓度的目标蛋白,做回收实验,得出回收率范围及平均回收率。将5个样本分别稀释2倍,4倍,8倍,16倍做回收实验,得出回收率范围及平均回收率。
| Serum (n=5) | EDTA plasma (n=5) | Cell culture media (n=5) | ||
|---|---|---|---|---|
| 1:2 | Range (%) | 93-101 | 92-113 | 89-108 |
| Average (%) | 96 | 100 | 94 | |
| 1:4 | Range (%) | 92-110 | 92-115 | 90-107 |
| Average (%) | 104 | 112 | 100 | |
| 1:8 | Range (%) | 94-112 | 90-115 | 91-107 |
| Average (%) | 99 | 90 | 97 | |
| 1:16 | Range (%) | 93-110 | 89-113 | 89-110 |
| Average (%) | 94 | 93 | 93 |
检测流程/ Assay Procedures