产品属性/ Product Details
| 产品名称 | Human IGFBP-1(Insulin-like Growth Factor Binding Protein 1) ELISA Kit | 反应种属 | Human |
| Uniprot ID | P08833 | 别称 | Insulin-like growth factor-binding protein 1,IBP-1; IGF-binding protein 1; IGFBP-1,Placental protein 12,PP12,IGFBP1,IBP1 |
| 检测方法 | Sandwich | 灵敏度 | 0.08 ng/mL |
| 标准品 | 10ng/mL | 检测范围 | 0.16-10ng/mL |
| 样品类型 | Serum, Plasma, Tissue homogenate and Other biological samples;Sample Volume=100μL | ||
| 检测时间 | 3.5H | 研究领域 | Developmental science; |
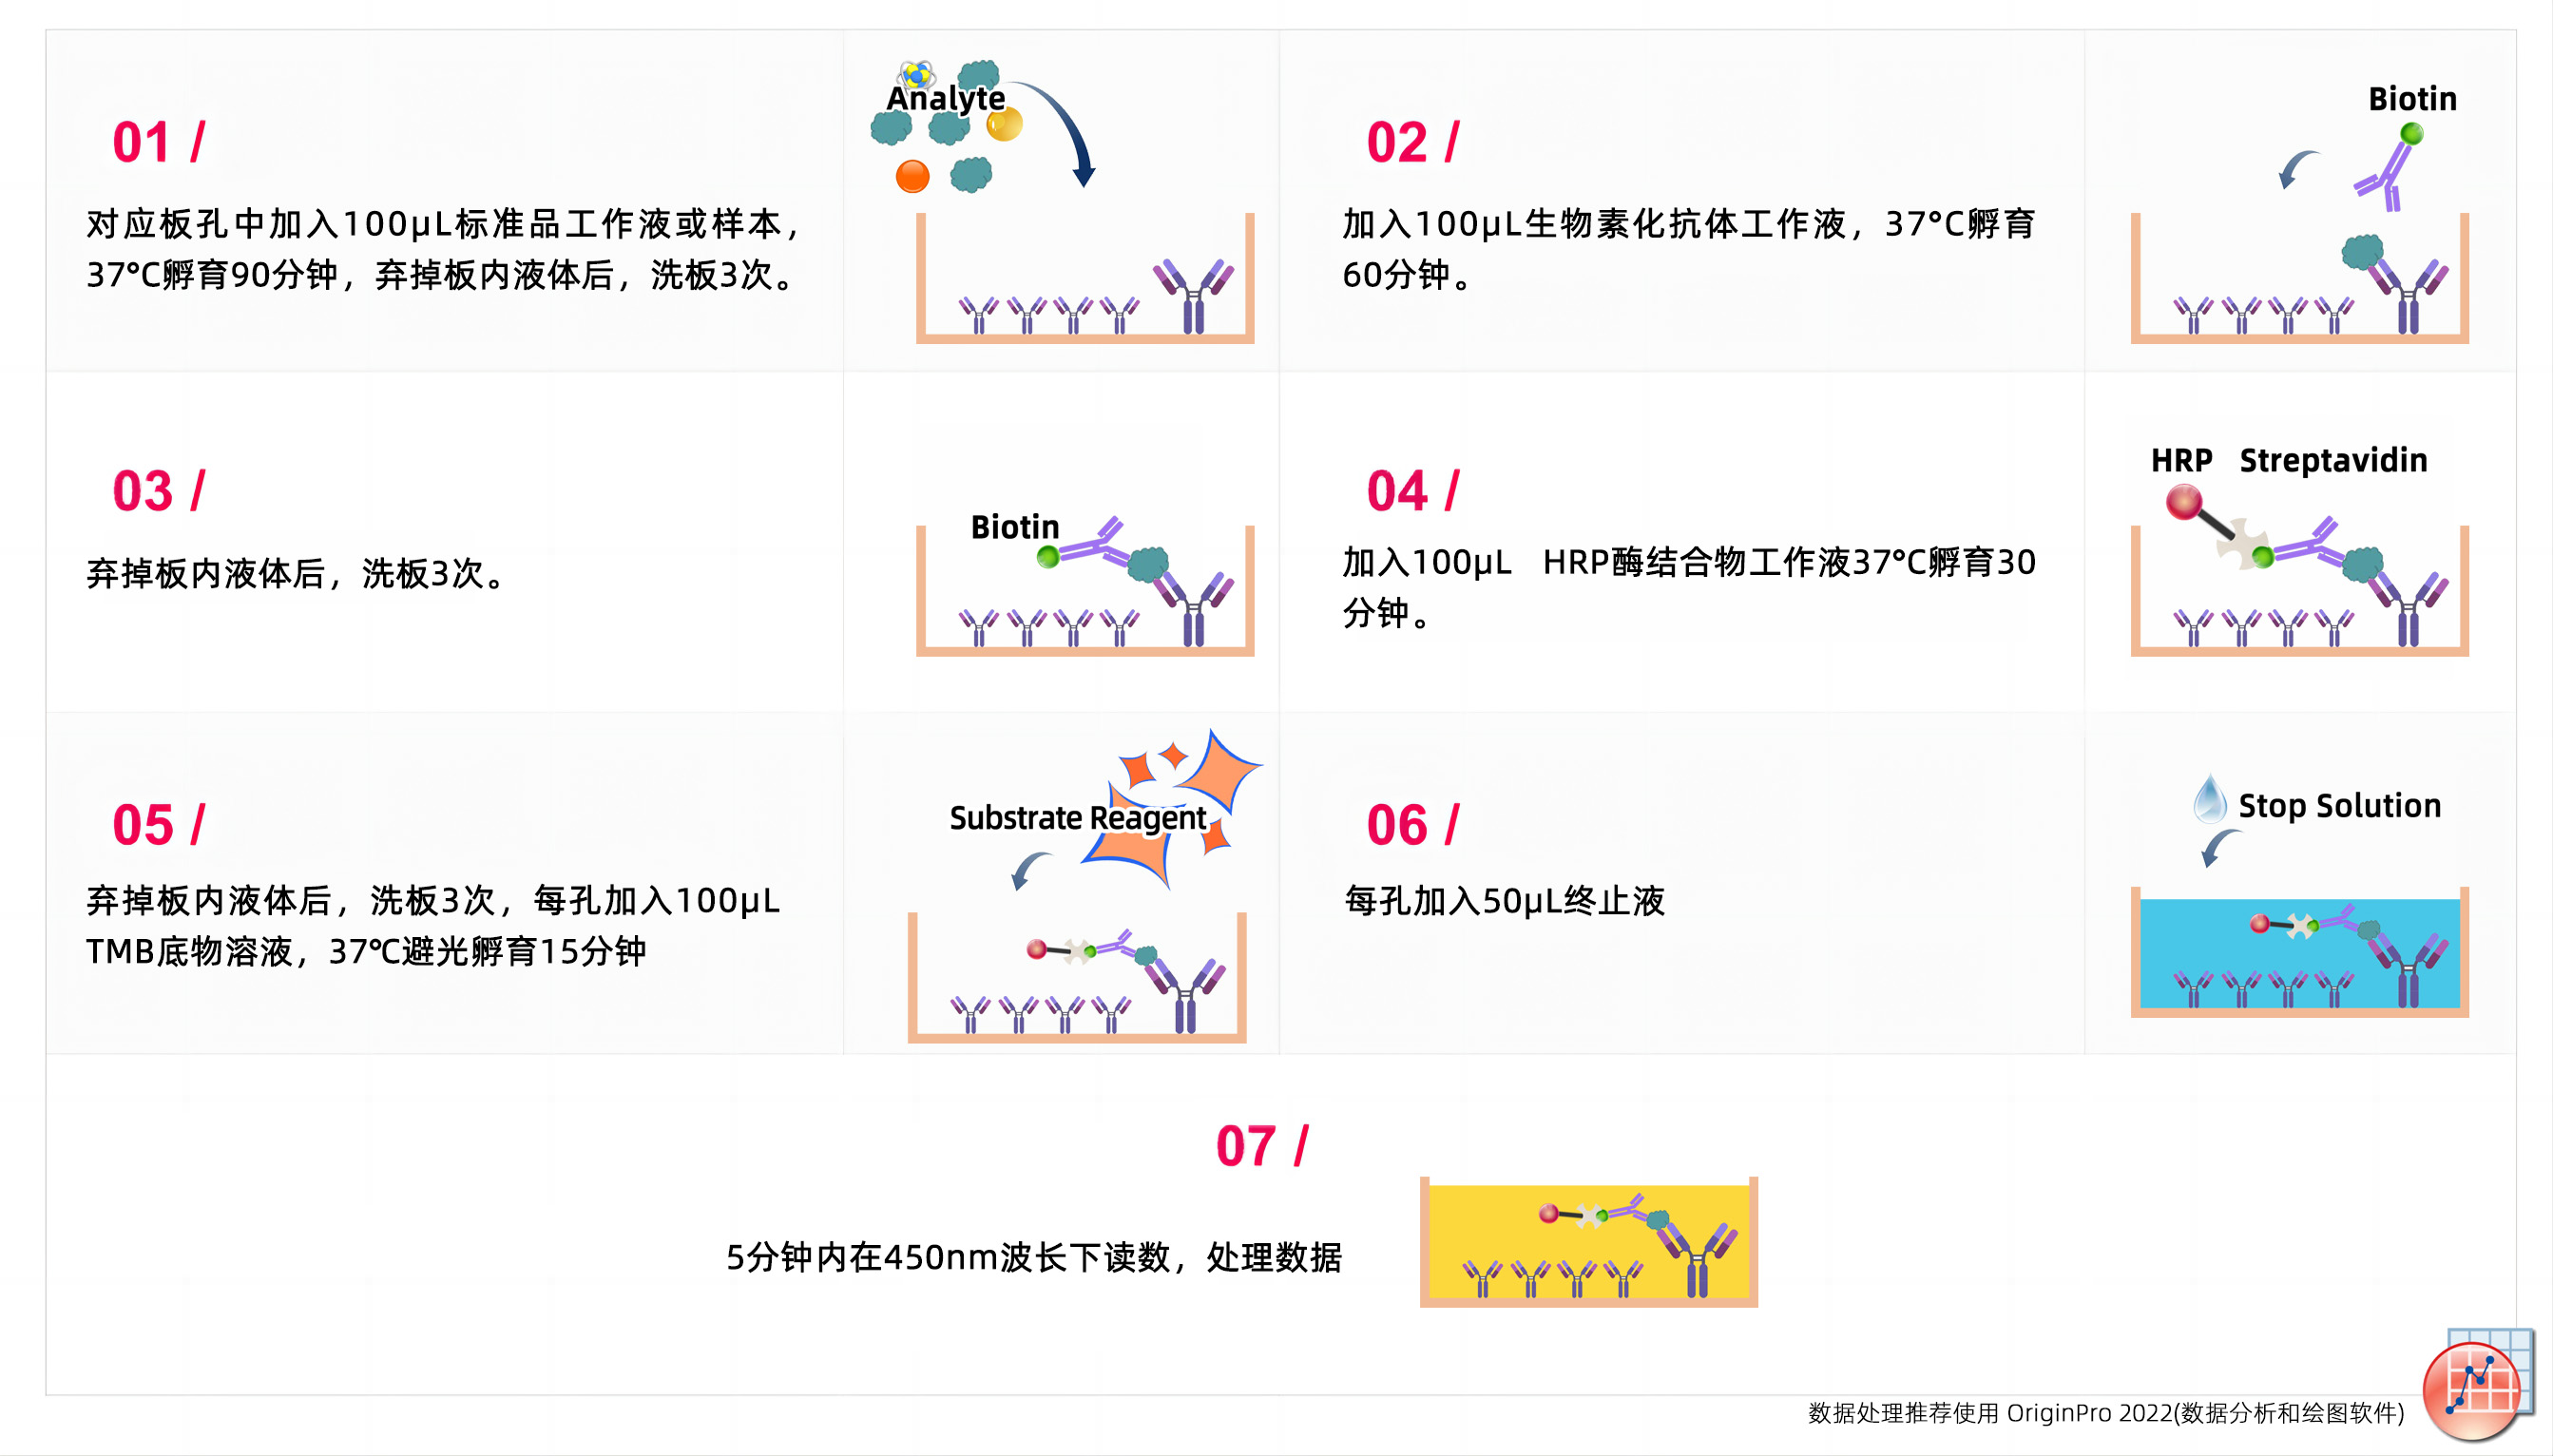
| 测试原理 | This ELISA kit uses the Sandwich-ELISA principle. The micro ELISA plate provided in this kit has been pre-coated with an antibody specific to Human IGFBP-1. Standards or samples are added to the micro ELISA plate wells and combined with the specific antibody. Then a biotinylated detection antibody specific for Human IGFBP-1 and Avidin-Horseradish Peroxidase (HRP) conjugate are added successively to each micro plate well and incubated. Free components are washed away. The substrate solution is added to each well. Only those wells that contain Human IGFBP-1, biotinylated detection antibody and Avidin-HRP conjugate will appear blue in color. The enzyme-substrate reaction is terminated by the addition of stop solution and the color turns yellow. The optical density (OD) is measured spectrophotometrically at a wavelength of 450 nm ± 2 nm. The OD value is proportional to the concentration of Human IGFBP-1. You can calculate the concentration of Human IGFBP-1 in the samples by comparing the OD of the samples to the standard curve. | ||
技术数据/ Technical Data
由于实验操作条件的不同(如操作者、移液技术、洗板技术和稳定条件等),标准曲线的OD值会有所差异。以下数据和曲线仅供参考,实验者需根据自己的实验建立标准曲线。
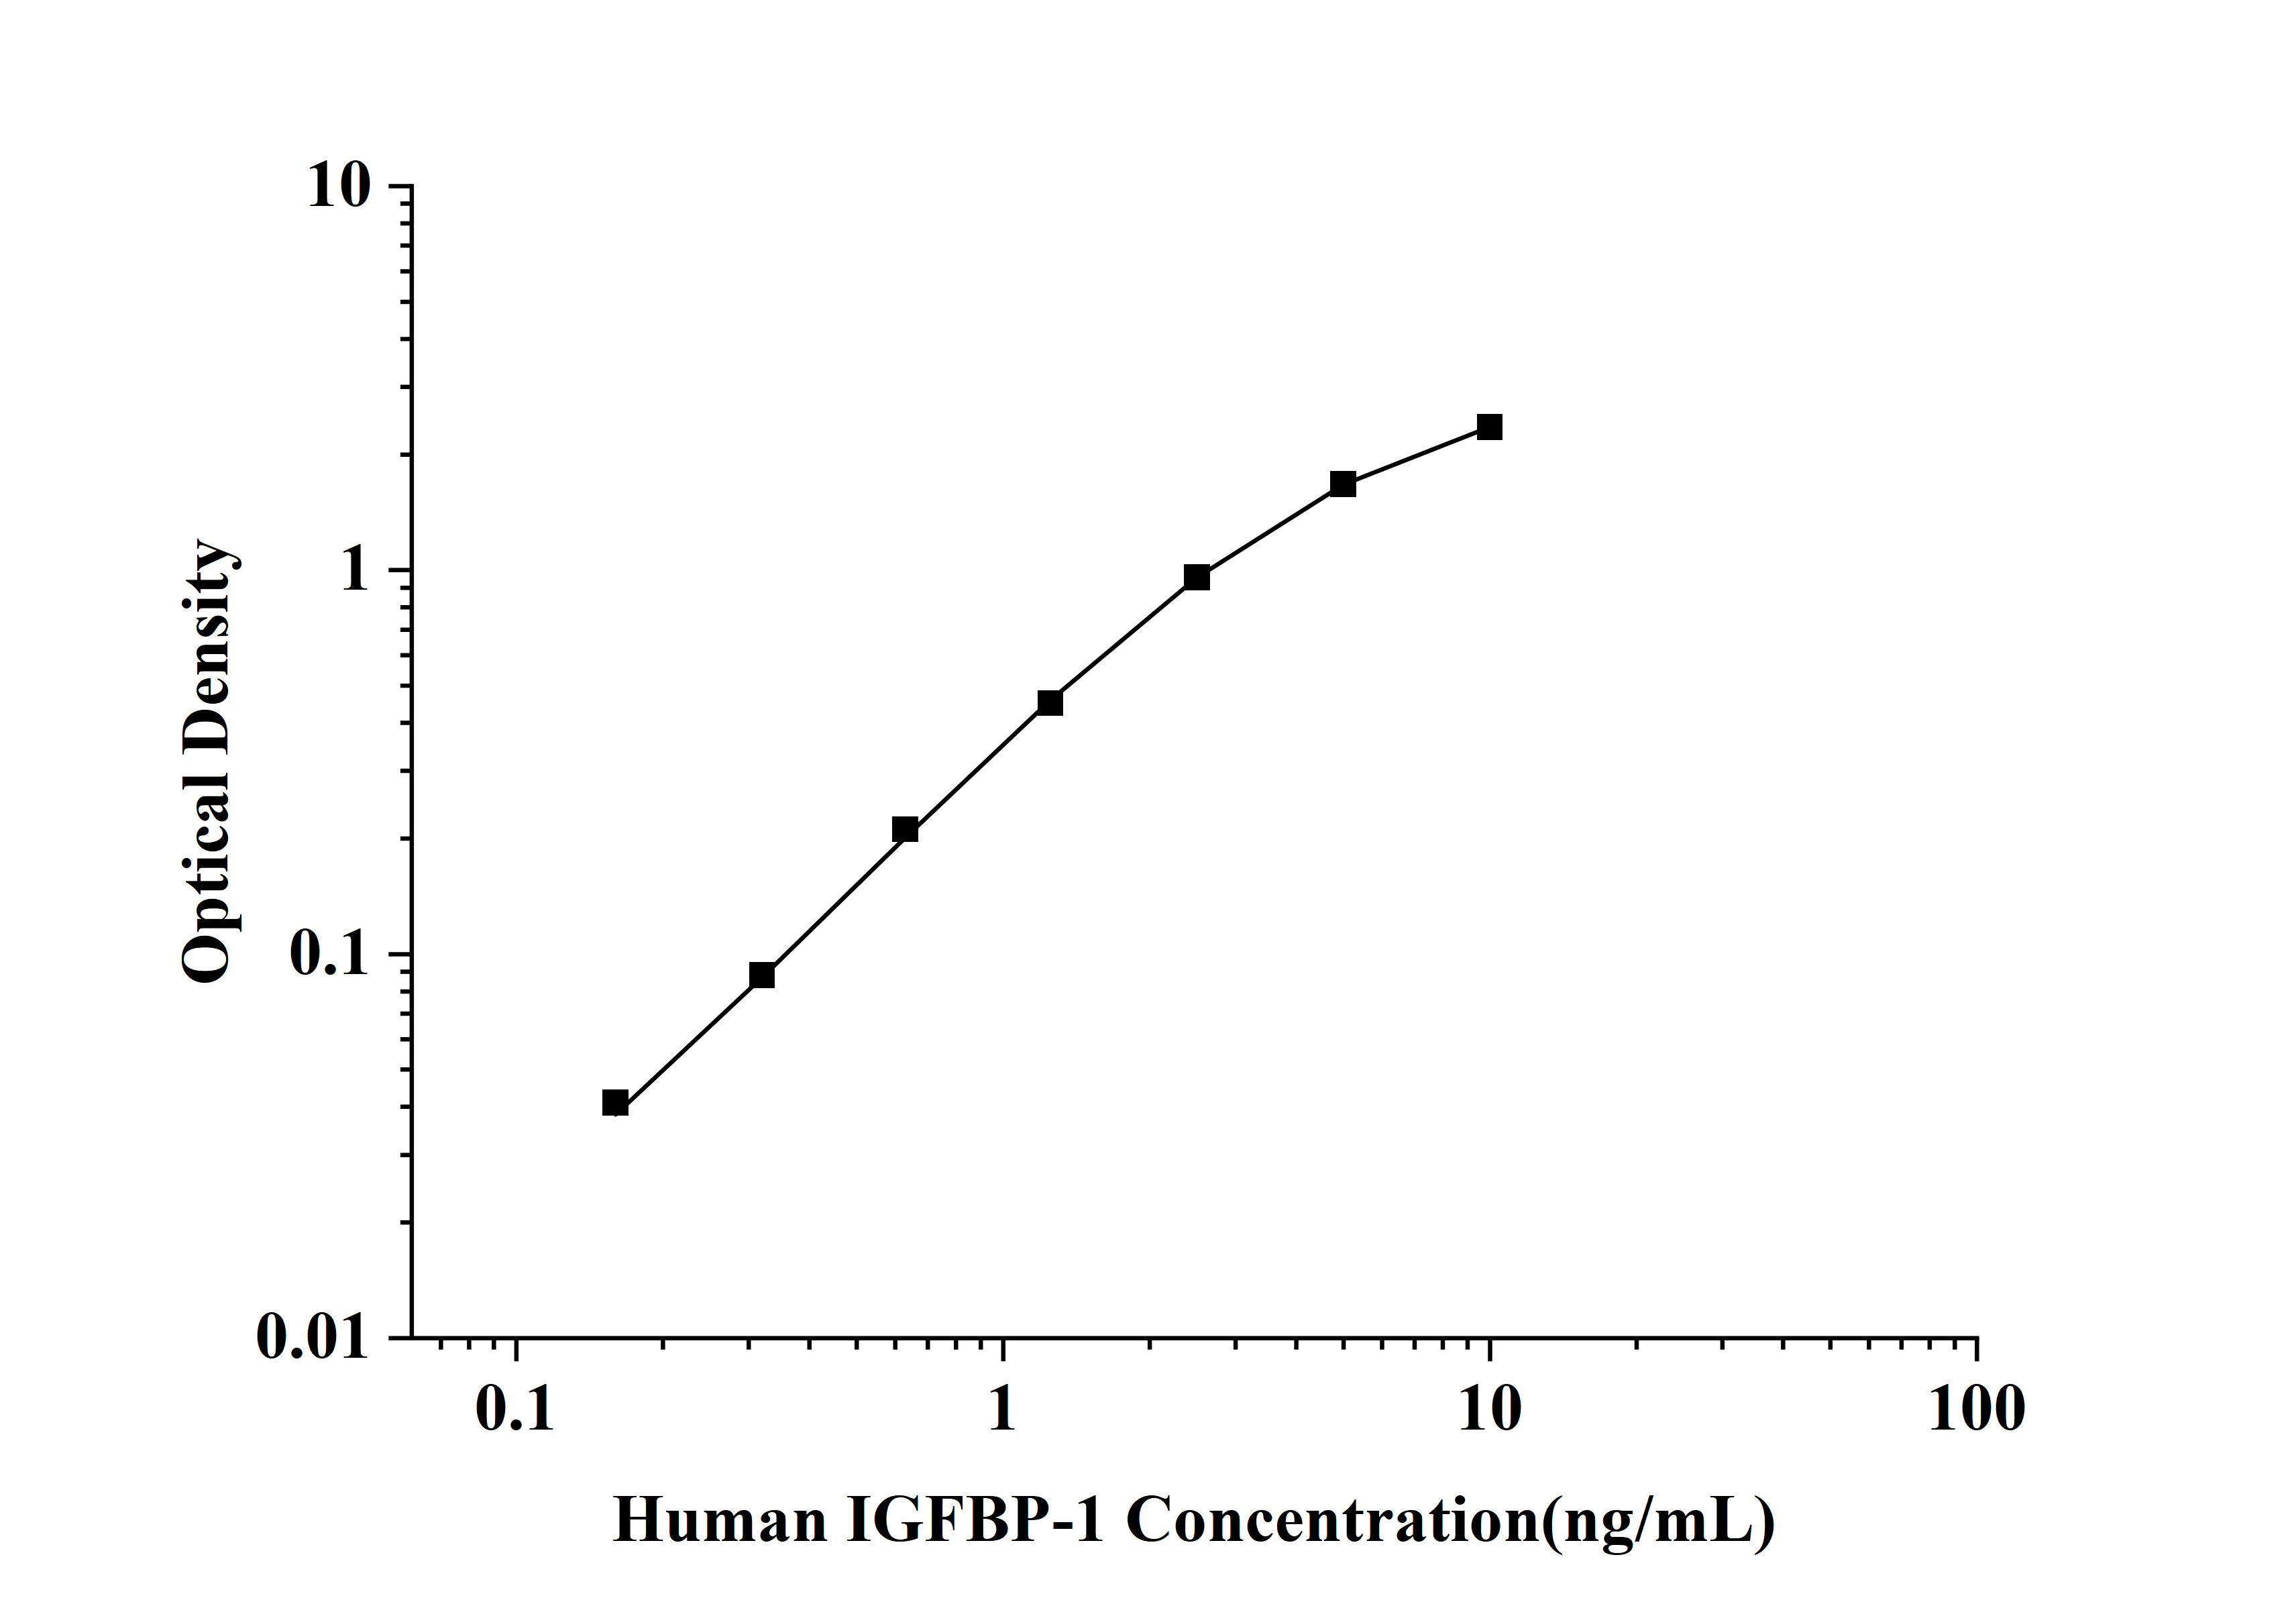
| (ng/mL) | OD | Corrected |
|---|---|---|
| 10.00 | 2.422 | 2.358 |
| 5.00 | 1.737 | 1.673 |
| 2.50 | 1.021 | 0.957 |
| 1.25 | 0.514 | 0.450 |
| 0.63 | 0.275 | 0.211 |
| 0.32 | 0.152 | 0.088 |
| 0.16 | 0.105 | 0.041 |
| 0.00 | 0.064 | 0.000 |
精密度
板内精密度:低浓度样本,中浓度样本和高浓度样本分别在1块板子上检测20次。
板间精密度:低浓度样本,中浓度样本和高浓度样本分别在3块板子上检测20次。
| Intra-assay Precision | Inter-assay Precision | |||||
|---|---|---|---|---|---|---|
| Sample | 1 | 2 | 3 | 1 | 2 | 3 |
| n | 20 | 20 | 20 | 20 | 20 | 20 |
| Mean(ng/mL) | 0.19 | 1.4 | 4.05 | 0.3 | 2.4 | 3.93 |
| Standard deviation | 0.01 | 0.09 | 0.21 | 0.01 | 0.08 | 0.15 |
| C V (%) | 2.67 | 5.44 | 3.61 | 5.76 | 5.64 | 5.35 |
回收率
分别往5个不同样本中添加已知浓度的目标蛋白,做回收实验,得出回收率范围和平均回收率。
| Sample Type | Range(%) | Average Recovery(%) |
|---|---|---|
| Serum (n=8) | 91-105 | 98 |
| EDTA plasma (n=8) | 81-95 | 88 |
| Cell culture media (n=8) | 85-97 | 91 |
线性
分别往5个样本中添加已知浓度的目标蛋白,做回收实验,得出回收率范围及平均回收率。将5个样本分别稀释2倍,4倍,8倍,16倍做回收实验,得出回收率范围及平均回收率。
| Serum (n=5) | EDTA plasma (n=5) | Cell culture media (n=5) | ||
|---|---|---|---|---|
| 1:2 | Range (%) | 95-103 | 86-93 | 99-105 |
| Average (%) | 102 | 87 | 103 | |
| 1:4 | Range (%) | 99-106 | 86-93 | 89-98 |
| Average (%) | 105 | 88 | 93 | |
| 1:8 | Range (%) | 80-92 | 91-105 | 83-103 |
| Average (%) | 86 | 98 | 100 | |
| 1:16 | Range (%) | 83-97 | 87-99 | 98-105 |
| Average (%) | 88 | 90 | 104 |
检测流程/ Assay Procedures